Difference between revisions of "Forest Fire Scripted Design"
Jump to navigation
Jump to search
imported>Andri |
imported>Andri |
||
| (2 intermediate revisions by the same user not shown) | |||
| Line 1: | Line 1: | ||
| + | [[Image:Forestfire.png|right|300px]] | ||
| + | [[Image:Forestfiregraph.png|right|300px]] | ||
| + | |||
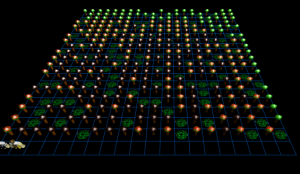
Computational science application for running automatic forest fire experiments, with automatically changing forest densities: | Computational science application for running automatic forest fire experiments, with automatically changing forest densities: | ||
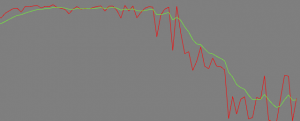
| − | * '''Single sample per density forest''': runs the simulation once per density value and plots the number of remaining trees for each of the samples and a trend line for the data. | + | * '''Single sample per density forest''': runs the simulation once per density value and plots the number of remaining trees for each of the samples (in red) and a trend line for the data (in green). |
* '''Multi sample per density forest''': runs the simulation 5 times per density value, plots the average number of remaining trees from the 5 samples, and then moves on to the next density value. This also plots a trend line. | * '''Multi sample per density forest''': runs the simulation 5 times per density value, plots the average number of remaining trees from the 5 samples, and then moves on to the next density value. This also plots a trend line. | ||
[[Category:AgentCubes_Design]] | [[Category:AgentCubes_Design]] | ||
Latest revision as of 00:21, 1 December 2011


Computational science application for running automatic forest fire experiments, with automatically changing forest densities:
- Single sample per density forest: runs the simulation once per density value and plots the number of remaining trees for each of the samples (in red) and a trend line for the data (in green).
- Multi sample per density forest: runs the simulation 5 times per density value, plots the average number of remaining trees from the 5 samples, and then moves on to the next density value. This also plots a trend line.